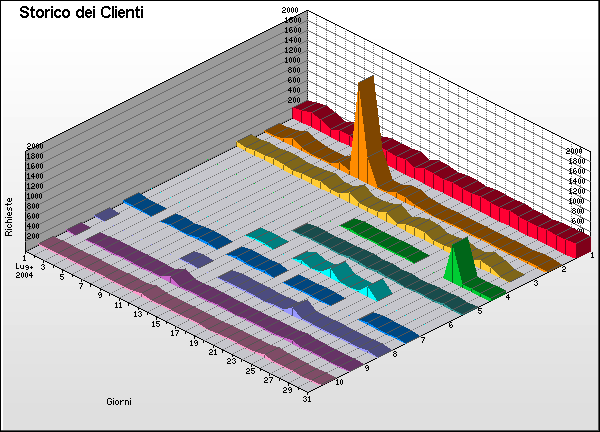
Statistiche generate da Archimede
Cliente Graph
Go the Help Card.


Storico dei Clienti
  Cliente Richieste % Byte % Sessioni Tempo Medio Pagine Errori
1 217.154.245.251
8,320    11.1%
0    0%
466 24:37 8,320 8,018
2 65.54.188.68
3,619    4.83%
0    0%
619 04:40 3,287 1,021
3 msnbot64049.search.msn.com
3,157    4.21%
0    0%
1,100 04:26 2,998 932
4 wirtanen.iol.it
1,120    1.49%
0    0%
70 01:13 623 79
5 host243-234.pool8017.interbusiness.it
495    <1%
0    0%
154 02:11 493 2
6 213.215.201.205
494    <1%
0    0%
16 08:17 479 66
7 69.31.79.226
440    <1%
0    0%
137 02:46 213 0
8 64.242.88.10
395    <1%
0    0%
193 01:45 349 26
9 crawler14.googlebot.com
375    <1%
0    0%
229 01:49 369 28
10 crawler10.googlebot.com
373    <1%
0    0%
253 01:35 367 35
  Sub-Totali
18,788    25.1%
0    0%
3,237 355:58:19 17,498 10,207
10,241 Altri
56,147    74.9%
0    0%
25,616 30:29 50,472 4,729
  Media
7    <1%
0    0%
2 01:59 6 1
10,251 Totali
74,935    100%
0    0%
28,853 956:28:48 67,970 14,936
Go the Help Card.

Help Card: Storico dei Clienti
Report Overview This report shows the IP addresses and/or hostnames of visitors to your site, along with their site usage statistics over time. Use this information to assess trends in site usage by certain known visitors, such as prospective customers who have showed interest in a certain product. Every session undertaken and all pages viewed by each of the visitors in this report can be seen in the Visitors Click Stream report.

If only IP addresses (such as 192.77.210.55) are showing in the report, then you may need to enable DNS lookups, in Settings > Analysis > Network > DNS. Bear in mind that not all IP addresses on the Internet have a name associated with them.

Note: one visitor address or hostname may actually represent multiple visitors, and at times, hundreds or even thousands of visitors. This is due to the widespread usage of proxy servers, which store web sites to enable faster and cheaper access for those utilizing it. This problem can be overcome through the use of authenticating procedures (visitors logging in to the site with a username and password), or, in part, through the use of cookies.

Graph Description Vertical axis: Hits (default sorting).
Changing the sorting options in Settings > Statistics will alter the vertical axis to the new sort method. This report can be sorted/graphed by hits, bytes, sessions, pages and errors.

Horizontal axis: Days.
All days of the report period.

Depth (Z) axis: Visitors.
The numbers along this axis correspond to the numbered entries in the table.

Table Description Visitor:
IP address or hostname of the visitor being analyzed.

Hits (%):
Number of hits to the site by the corresponding visitor. (Percentage as a proportion of hits to the site by all visitors.)

Bytes (%):
Bytes transferred as a result of hits by the corresponding visitor. (Percentage as a proportion of the bytes transferred as a result of hits by all visitors.)

Sessions:
Number of sessions undertaken by the corresponding visitor.

Mean time:
The average time spent on the website during each session undertaken by the corresponding visitor. It is represented in hours, minutes and seconds (HH:MM:SS).

Pages:
Number of pages viewed by the corresponding site visitor.

Errors:
Errors generated as a result of hits to the site by the corresponding visitor.
Go back to the top.

Copyright © A.S.I. srl, 1996-2002